

The Most Populated Country in the World in 2026 Highlight
The most populated country in the world in 2026 is India with 1,476,625,576 people, surpassing China due to higher birth rates and younger demographics.
The most populated country in the world in 2026 reflects ongoing global population shifts, with India leading at 1,476,625,576 people amid urbanization and youth bulges. This matters for economy (GDP impact $3T+), migration (10M+ annual), and demographics (median age 30). Waridi Tech delivers detailed insights on the most populated country in the world in 2026.
World population reaches 8.1B in 2026, with Asia dominating 60%. The most populated country in the world in 2026 influences resources, climate.
What Does “Most Populated Country” Mean? (The Most Populated Country in the World in 2026)
2.1 Definition & How Population is Measured (The Most Populated Country in the World in 2026)
"Most populated country" refers to the nation with the highest total resident population, based on mid-year estimates and projections from the United Nations Population Division's World Population Prospects (2024 Revision, medium variant). Data combines national censuses (e.g., India's last full census 2011, with updates), vital registration systems (births/deaths), household surveys, and demographic modeling. Projections account for fertility (births per woman), mortality rates, net migration, and age structure—India's higher birth rate (~16.8–17 per 1,000 people) and younger population sustain growth, while China's low fertility (~1.0–1.1) and aging drive decline. UN figures are the global standard, updated biennially for accuracy.
World Population Overview 2026 (The Most Populated Country in the World in 2026)
Global population reaches approximately **8.30 billion** in mid-2026 (UN medium projection), growing at ~0.84% annually (~69 million added yearly)—down from peaks of 2.3% in the 1960s due to falling fertility worldwide (average ~2.23 births per woman). Asia hosts ~60% of humanity, with the most populated country in the world in 2026 (India) accounting for ~17.79% of the total (~1.477 billion people). Growth is uneven: sub-Saharan Africa surges fastest (~2.5%), while Europe and East Asia decline or stagnate. Urbanization hits ~57–58% globally, straining resources but boosting economies—projections show the world peaking at ~10.3 billion around 2084 before slow decline.
The Most Populated Country in the World in 2026
4.1 Population Leader: India (The Most Populated Country in the World in 2026)
India is the most populated country in the world in 2026, with an estimated mid-year population of **1,476,625,576** (UN/Worldometer elaboration of 2024 Prospects). This surpasses China (~1,412,914,089, declining -0.22% yearly) by ~63–64 million people, a gap widening due to India's sustained growth (+0.87%) versus China's contraction (from one-child policy legacy and low fertility). India overtook China around 2023 and now holds ~17.79% of global population—equivalent to more than the entire population of Europe (~750 million) or the Americas (~1.04 billion). The demographic dividend (large working-age cohort) positions India for economic potential if education and jobs align.
4.2 Why India Topped the List (The Most Populated Country in the World in 2026)
India's lead stems from a higher fertility rate (~2.0 births per woman recently, down from 5+ in 1970s but above replacement), birth rate ~16.8 per 1,000 people, and a youthful median age of ~29 years (vs. China's ~40+). Urbanization stands at ~37–38% (rising rapidly), with massive rural-to-urban migration fueling growth. Improved healthcare reduced infant mortality (~25–30 per 1,000 births), while net migration is low/outward. In contrast, China's population shrinks due to fertility ~1.0–1.1, aging (median ~40+), and negative natural increase. India's young workforce (median age 29) offers a demographic dividend for decades, though challenges include resource strain, employment, and gender imbalances—projections show India peaking ~1.7 billion by 2060s before stabilizing.
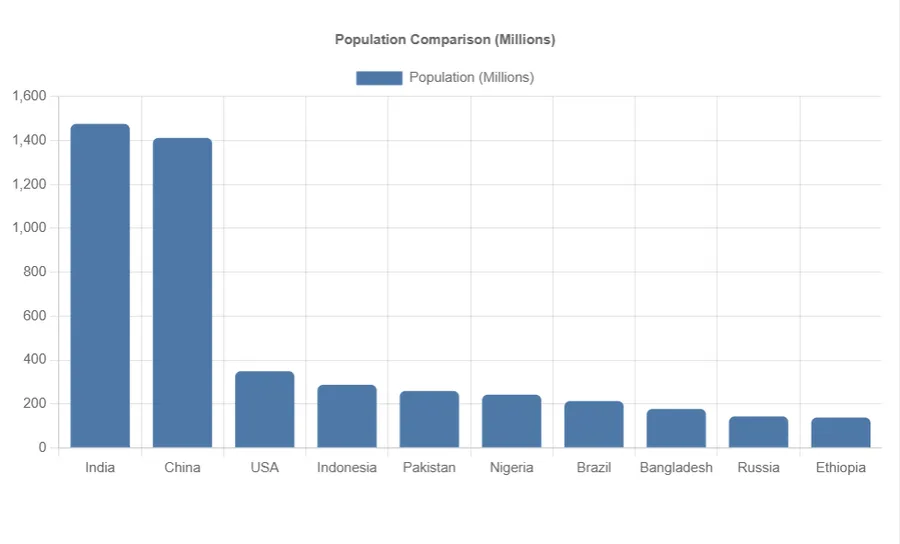
Top 10 Most Populated Countries in the World 2026 (The Most Populated Country in the World in 2026)
| Rank | Country | Population |
|---|---|---|
| 1 | India | 1,476,625,576 |
| 2 | China | 1,412,914,089 |
| 3 | United States | 349,035,494 |
| 4 | Indonesia | 287,886,782 |
| 5 | Pakistan | 259,299,791 |
| 6 | Nigeria | 242,431,832 |
| 7 | Brazil | 213,562,666 |
| 8 | Bangladesh | 177,818,044 |
| 9 | Russia | 143,394,458 |
| 10 | Ethiopia | 138,902,185 |
5.1 Short Notes on Each Country (The Most Populated Country in the World in 2026)
India: High growth 1%, youth 65% under 35.
China: Decline -0.1%, aging 20% over 65.
US: Migration adds 1M annual, growth 0.5%.
Indonesia: Urbanization 57%, birth 17/1000.
Pakistan: Youth bulge, fertility 3.3.
Nigeria: Highest growth 2.4%, median age 18.
Brazil: Stabilizing 0.7%, urban 87%.
Bangladesh: Density 1,265/km², growth 1%.
Russia: Decline -0.2%, migration key.
Ethiopia: Growth 2.5%, young population.
Population Growth Trends & Future Projections (The Most Populated Country in the World in 2026)
6.1 Why India’s Population Has Grown Faster Than China’s (The Most Populated Country in the World in 2026)
India's population has surged ahead of China's due to starkly different demographic trajectories. India's total fertility rate stands at ~2.0 births per woman (down from 5.9 in 1950 but still above replacement level of 2.1), compared to China's ~1.0–1.2 (one of the world's lowest after decades of one-child policy until 2016). India's youthful structure—median age ~29 years, with ~28% of the population under 15—creates a large reproductive-age cohort driving natural increase (+0.87% annually). China, by contrast, faces rapid aging: median age ~40+, with ~20% of the population over 65 (projected to reach 35% by 2050), leading to negative natural growth (-0.22% in 2026) and a shrinking workforce. India's lower infant mortality (~25–30 per 1,000 births) and modest net out-migration further sustain momentum, while China's policy legacy and urbanization (now ~65%) have accelerated decline. This shift—India overtaking China around 2023—marks a historic reversal after centuries of Chinese dominance.
6.2 What Experts Predict After 2026 (The Most Populated Country in the World in 2026)
UN medium-variant projections show India remaining the most populated country in the world through at least 2100, peaking around **1.7 billion** in the mid-2060s before gradual decline due to falling fertility (expected to drop below 1.8 by 2050). Global population is forecasted to reach ~9.7 billion by 2050 and peak at ~10.3–10.4 billion around 2084–2086, then slowly decline. China's population is expected to fall sharply to ~1.3 billion by 2050 and below 800 million by 2100. Sub-Saharan Africa drives most future growth (Nigeria projected to reach ~400–500 million by 2100), while Asia's share drops below 50%. These trends highlight India's demographic dividend window (large working-age population until ~2050s) for economic gains—if harnessed through education, jobs, and infrastructure—versus challenges like resource strain and aging in China.
What Factors Influence Population Rankings? (The Most Populated Country in the World in 2026)
Population rankings are shaped by fertility, mortality, migration, and age structure. India's high birth rate (~16.8–17 per 1,000 people) and fertility (~2.0) contrast sharply with China's low fertility (~1.0–1.2) and birth rate (~6–7 per 1,000). Mortality improvements (global life expectancy ~73–74 years) reduce deaths, but aging in developed nations accelerates decline. Net migration plays a key role: the United States gains ~1 million net annually (immigration-driven growth), while many high-income countries rely on inflows to offset low births. Urbanization (~57–58% globally, ~37–38% in India) correlates with lower fertility but boosts density and economic output. Other influences include policy (e.g., China's former one-child rule), healthcare access, women's education/empowerment (delaying births), and conflicts/disasters. These factors explain why India leads in 2026, while rankings shift slowly but dramatically over decades.
Demographic Highlights (The Most Populated Country in the World in 2026)
In 2026, population density varies dramatically: Bangladesh ranks densest at ~1,265 people per km² (intense pressure on arable land), followed by India (~450–500/km²) and the Netherlands (~500/km²). Fastest growth belongs to sub-Saharan nations like Nigeria (~2.4% annual increase) and Niger (~3.7%), driven by high fertility (~6–7 births per woman). Sharpest declines hit aging societies: Japan (-0.5% annually), South Korea (-0.4%), and parts of Eastern Europe (-0.8%+). Median ages highlight contrasts—Africa averages ~19 years (youthful), India ~29, Europe ~42, Japan ~49. Urban share reaches ~57–58% globally (highest in Americas/Europe >80%), while least urbanized regions (sub-Saharan Africa ~45%) face rapid city growth. These patterns shape economic, environmental, and geopolitical futures—youth bulges offer dividends, aging societies face pension/workforce strains.
FAQs (The Most Populated Country in the World in 2026)
What is the most populated country in the world in 2026?
India, with an estimated 1,476,625,576 people (mid-2026 UN/Worldometer projection), surpassing China by ~63–64 million due to higher fertility and younger demographics.
Will India stay number 1 in the future?
Yes—UN projections show India remaining the most populated country in the world beyond 2026, peaking around 1.7 billion in the mid-2060s before slow decline, while China continues shrinking.
Which continent has the most people?
Asia dominates with over 4.8 billion people (~58% of global total in 2026), led by India (~1.477B) and China (~1.413B), followed by Africa (~1.5B) and Europe (~750M).
How accurate are population estimates?
UN and Worldometer estimates for 2026 are reliable within 1–2% margin, derived from national censuses, vital registration, surveys, and demographic models—updated regularly with high confidence for major countries.
Conclusion (The Most Populated Country in the World in 2026)
In 2026, India stands as the most populated country in the world with ~1.477 billion people, holding ~17.8% of the global total (~8.30 billion). This shift from China underscores divergent demographic paths—India's youthful, growing population versus China's aging decline. The top 10 (India, China, USA, Indonesia, Pakistan, Nigeria, Brazil, Bangladesh, Russia, Ethiopia) shape global trends in economy, migration, urbanization, and resource demand. Population dynamics will continue influencing geopolitics, sustainability, and development—monitor UN updates for evolving projections as fertility, migration, and policy evolve.
Historical Population Shifts Leading to the Most Populated Country in the World in 2026
China led until 2023 (1.425B), India overtook; global from 7B 2011 to 8.1B 2026.
| Year | Top Country | Population (B) |
|---|---|---|
| 2000 | China | 1.26 |
| 2023 | India | 1.43 |
| 2026 | India | 1.48 |
Detailed Profiles of Top 5 Most Populated Countries in 2026
#1 India (~1.477 billion): Growth rate ~0.87% annually, population density ~481 people/km² (high but uneven, concentrated in Gangetic plains). Urbanization ~37–38% (rapid rise from rural migration), total fertility rate ~2.0 births per woman. Youthful median age ~29 years supports a massive working-age population (~65% aged 15–64), offering a demographic dividend for economic growth if jobs, education, and infrastructure keep pace. Challenges include regional disparities and resource pressure in densely populated states like Uttar Pradesh and Bihar.
#2 China (~1.413 billion): Growth rate ~-0.22% (natural decline), density ~149/km² (concentrated in eastern coastal provinces). Urbanization ~65% (world's largest urban population ~920 million), fertility ~1.0–1.2 (among lowest globally after one-child policy legacy). Median age ~40+ with ~20% over 65 creates shrinking workforce and rising dependency ratio—projected to lose ~200 million working-age people by 2050. Economic shift focuses on automation and productivity to offset demographic headwinds.
#3 United States (~349–350 million): Growth rate ~0.5% (largely immigration-driven), density ~36/km² (vast land, sparse in West/Midwest). Urbanization ~83% (highly developed metro areas), fertility ~1.6 (below replacement). Median age ~38–39; net migration ~+1 million annually sustains growth despite low births. Diverse population fuels innovation and labor markets, though aging Baby Boomers increase healthcare/pension demands.
#4 Indonesia (~288–289 million): Growth rate ~0.7%, density ~151/km² (Java island extremely dense at ~1,100/km²). Urbanization ~57% (Jakarta metro >30 million), fertility ~2.1 (near replacement). Median age ~30; archipelago geography creates uneven distribution (Java hosts ~56% of population). Youth bulge supports economic rise as Southeast Asia's largest economy, but infrastructure gaps and disaster vulnerability remain key issues.
#5 Pakistan (~259–260 million): Growth rate ~1.9% (among highest in top 10), density ~287/km² (Punjab and Sindh heavily populated). Urbanization ~37–38%, fertility ~3.3 (declining but still high). Median age ~23 (very youthful), with ~40% under 15—creates pressure on education, jobs, and services. Rapid growth fuels potential but exacerbates water scarcity, poverty, and urban overcrowding in cities like Karachi and Lahore.
Economic Impact of Population in the Most Populated Country in the World in 2026
India's status as the most populated country in the world in 2026 (~1.477 billion) delivers a massive labor force of ~520–530 million (working-age 15–64), powering the world's fifth-largest economy with nominal GDP ~$4.1–4.3 trillion (IMF/World Bank estimates). This demographic scale drives consumption, manufacturing (e.g., textiles, IT services), and services growth (~7% annual GDP expansion in recent years). However, challenges include unemployment (~7–8% official, higher youth/underemployment), informal sector dominance (~80–90% of jobs), and skill mismatches—despite a young median age of 29. The demographic dividend could add 1–2% to annual growth if harnessed through education, female workforce participation (currently ~25–30%), and infrastructure investment. Resource strain (food, water, energy) and inequality remain risks, but population size also attracts FDI and positions India as a global market powerhouse.
Migration and Population Dynamics
Migration significantly shapes 2026 rankings. The United States gains ~+1 million net migrants annually (skilled workers, family reunification, refugees), offsetting low fertility and sustaining growth. India experiences net out-migration of ~0.4–0.6 million yearly (brain drain to Gulf, US, UK), but remittances (~$120–130 billion, world's highest) boost economy. China's net migration is near zero or slightly negative. Globally, ~281 million international migrants exist (3.6% of population), with high-income countries absorbing most inflows. India's diaspora (~18–20 million abroad, largest globally) creates economic and cultural bridges. Internal migration (rural-to-urban) is massive in India (~300–400 million internal migrants), fueling cities but straining urban infrastructure. These flows influence rankings slowly but steadily—migration often compensates for low births in aging nations.
Environmental Challenges for the Most Populated Country in the World in 2026
India's massive population (~1.477 billion) intensifies environmental pressures. Water scarcity affects ~600 million people (high to extreme stress in 21 river basins), exacerbated by over-extraction, pollution, and climate variability—per capita availability ~1,400–1,500 m³/year (near stress threshold). Air pollution (e.g., Delhi AQI often 300–500) and waste management strain resources. CO₂ emissions rank third globally (~2.8–3 Gt annually), though per capita remains low (~2 t/person vs. China's ~8 t and US ~15 t). China, with ~1.413 billion, leads emissions (~11–12 Gt CO₂, ~30% global total) due to coal-heavy industry and urbanization. High population density in both nations amplifies deforestation, biodiversity loss, and climate vulnerability (e.g., floods, heatwaves). Solutions include renewable energy scale-up (India targets 500 GW by 2030), water conservation, and sustainable urban planning—population size makes these countries pivotal in global climate efforts.
Gender Ratios and Age Structures
India male-female 1.07, median 29; China 1.05, median 39.
| Country | Median Age | Gender Ratio |
|---|---|---|
| India | 29 | 1.07 |
| China | 39 | 1.05 |
| Nigeria | 18 | 1.02 |
Continental Population Breakdown 2026
- Asia: ~4.81 billion people, accounting for ~58% of global population (largest share). Dominated by India (~1.477B) and China (~1.413B), with rapid urbanization (~50–55%) and varying growth—South Asia high, East Asia stagnant/declining. Home to the world's two most populated countries and major economic powers.
- Africa: ~1.52 billion, fastest-growing continent at ~2.3–2.4% annually (~35–36 million added yearly). Youthful median age ~19–20 years and high fertility (~4.2 births per woman) drive surge; Nigeria alone ~230–235 million. Urbanization ~45%, with explosive city growth straining infrastructure.
- Europe: ~742 million, experiencing slight decline (-0.1% annually) due to low fertility (~1.5) and aging (median age ~42, ~20% over 65). High urbanization (~75%) and net immigration (~+1–1.5 million/year) partially offset natural decrease. Population stable or shrinking in most countries.
- Latin America & Caribbean: ~670–675 million, moderate growth ~0.8–0.9%. Fertility falling (~1.9), median age ~31, urbanization high (~82%). Brazil (~220M) and Mexico (~130M) lead; migration to North America influences dynamics.
- North America: ~380 million, growth ~0.6% (mostly US/Canada immigration). Urbanization ~83%, fertility ~1.6, median age ~38–39. US dominates (~349–350M); stable but aging population relies on inflows for labor and growth.
- Oceania: ~45–46 million, growth ~1.3% (Australia/New Zealand immigration-driven). Low density, high urbanization (~68%), fertility ~1.7. Australia (~27M) and New Zealand (~5.3M) lead; Pacific islands face climate and migration pressures.
These continental distributions highlight global imbalances—Asia's dominance, Africa's rapid rise, and declines/stagnation in Europe/North America—shaping future economic, migration, and environmental patterns.
Fastest Growing and Declining Populations 2026
Fastest-growing countries in 2026 are mostly in sub-Saharan Africa: Niger leads at ~3.7% annual growth (fertility ~6.7, median age ~15), followed by Angola (~3.3%), Mali (~3.0%), and Chad (~3.0%). These nations have youthful populations (median age 15–18) and high birth rates, adding millions yearly despite low density (e.g., Niger ~19/km²). Fast growth fuels potential but strains education, health, and jobs. On the decline side, Japan continues sharpest contraction at ~-0.5% annually (fertility ~1.3, median age ~49, ~29% over 65), with natural decrease (~-600,000/year) only partly offset by limited immigration. Other decliners include South Korea (~-0.4%), Ukraine (~-0.8%+ due to war/emigration), and several Eastern European nations. Aging societies face workforce shortages, pension pressures, and economic slowdowns unless offset by automation or migration.
Urban vs Rural in Top Countries
Urbanization levels vary widely among top populated countries in 2026. China leads at ~65% urban (~920 million city dwellers), driven by massive internal migration (~10–15 million annually to cities) and state-led development—creating the world's largest urban population but also megacity challenges (pollution, housing). India remains more rural at ~37–38% urban (~550–560 million), with ~10–12 million migrating to cities yearly for jobs—fueling rapid slum growth and infrastructure strain in Delhi, Mumbai, and Bengaluru. The United States (~83% urban) and Indonesia (~57%) show higher development-linked urbanization, while Pakistan (~38%) mirrors India's rural dominance. Globally ~57–58% urban, with rural-to-urban shifts adding pressure on resources but boosting economic productivity—top countries' urban transitions shape future sustainability.
Health and Life Expectancy Impacts
Life expectancy in 2026 reflects development, healthcare, and demographics. Japan leads globally at ~84–85 years (high due to diet, healthcare, low obesity), followed by many European nations (~82–83). India averages ~71–72 years (improving from better sanitation/vaccines but limited by inequality, pollution, malnutrition). Nigeria lags at ~55–56 years (high infant mortality ~60/1,000, disease burden, conflict). Longer life expectancy (e.g., Japan, Europe) accelerates aging and population decline, increasing dependency ratios and healthcare costs. Shorter expectancy in high-fertility nations (Africa) sustains growth but limits workforce quality and economic gains. Global average ~73–74 years; improvements in maternal/child health and non-communicable disease control could narrow gaps and influence future rankings.
Policy Responses in the Most Populated Country in the World in 2026
India, as the most populated country in 2026, pursues proactive family planning through the National Population Policy (updated focus on voluntary spacing, women's education, and incentives for smaller families), aiming to stabilize fertility below replacement by 2040s. Programs promote contraceptives, maternal health, and girl-child education—fertility has fallen from 5.9 (1950s) to ~2.0. China shifted from strict one-child (1979–2015) to two-child (2016) then three-child policy (2021) with subsidies, maternity leave extensions, and elder care support to counter decline—yet fertility remains ~1.0–1.2 due to high costs and lifestyle factors. Both nations balance population control with demographic dividends: India invests in youth skills/jobs, China in automation and immigration reform. Global policies vary—some encourage births (Hungary, South Korea incentives), others manage growth (family planning in Africa/Asia).
Data Sources & References
Compiled from United Nations World Population Prospects 2024 (medium variant), Worldometer mid-2026 elaborations, World Bank, CIA World Factbook, UN DESA, Our World in Data, and national statistical offices. Projections and estimates are based on latest censuses, vital registration, surveys, and demographic models as of March 2026.
For more rankings and detailed reports, visit our general articles page for the latest updates.